Domestic vs offshore landed cost: a worked example
SSG MFG engineering5 min readOffshore sourcing
Is offshore manufacturing cheaper once landed cost is counted?
Sometimes, but by far less than the quote suggests. In the illustrative example below, an aluminum die-cast housing at 10,000 parts a year quotes 34% cheaper offshore, yet lands only about 5% cheaper after tooling, freight, duty, inventory, and risk are counted. Raise the assumed duty rate above about 33%, or add one quality escape, and domestic wins.

What part and assumptions does this example use?
This is an illustrative model, not a quote. The numbers are plausible for the part described, and the method is the point: every line can be replaced with your own figures.
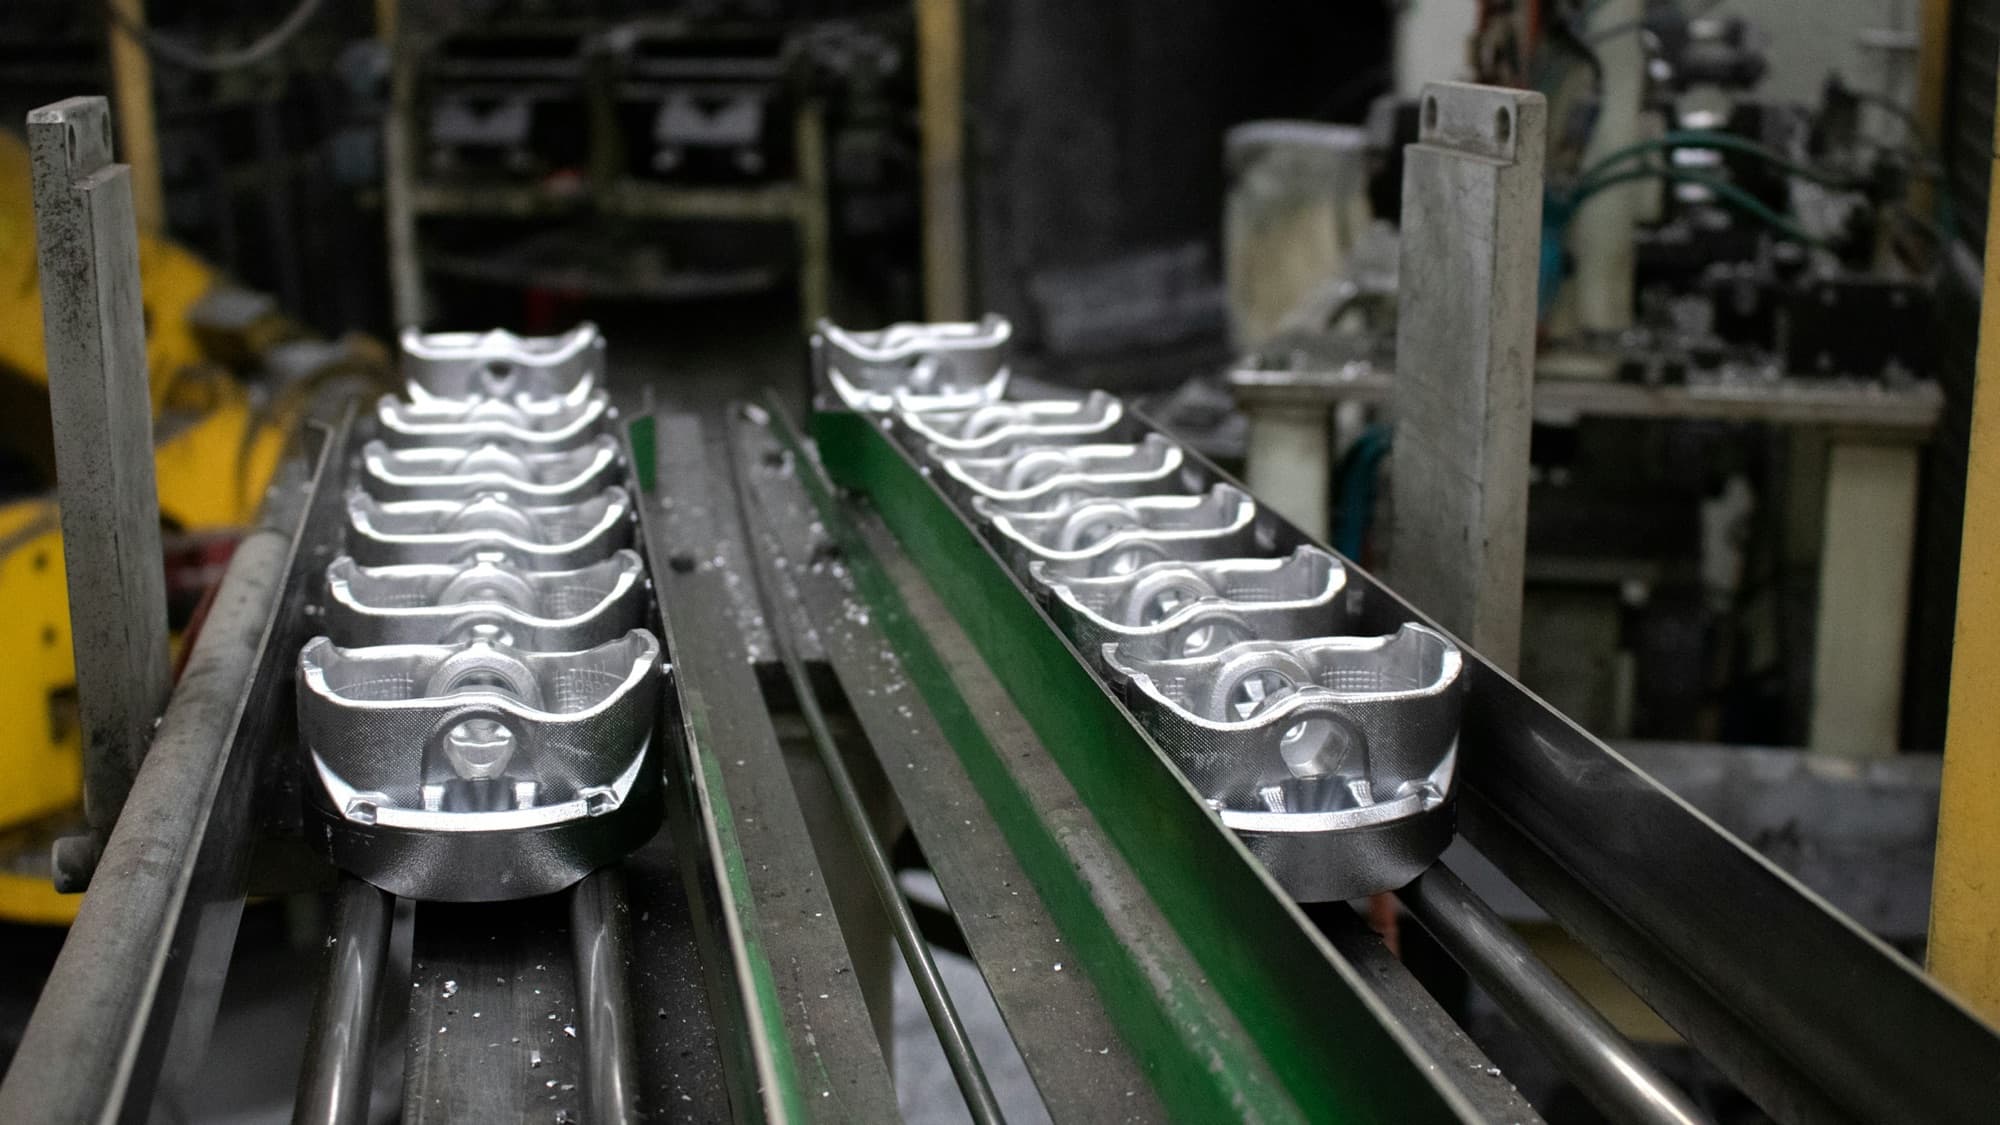
- Part: aluminum A380 die-cast housing, about 0.6 lb (0.27 kg), two machined bores, black powder coat.
- Volume: 10,000 parts per year, 3-year program life, so tooling is amortized over 30,000 parts.
- Domestic: $6.40 per part, $32,000 tooling, monthly releases by LTL truck.
- Offshore: $4.20 per part FOB port of export, $18,000 tooling, quarterly ocean shipments.
- Duty: an assumed combined 25% of customs value, chosen for illustration only.
- Inventory carrying cost: 25% of landed value per year.
- Inventory held: 4 weeks domestic; 16 weeks offshore, covering pipeline and safety stock.
How does landed cost compare line by line?
| Cost per part | Domestic | Offshore | Basis |
|---|---|---|---|
| Unit price | $6.40 | $4.20 | Supplier quote; offshore is FOB |
| Tooling amortization | $1.07 | $0.60 | Tool cost ÷ 30,000 parts |
| Freight to your dock | $0.12 | $0.38 | LTL truck vs ocean, drayage, and inland freight |
| Duty | $0.00 | $1.20 | 25% × ($4.20 unit price + $0.60 tooling assist) |
| Brokerage, bond, MPF, HMF | $0.00 | $0.07 | Per-entry fees across four entries a year |
| Inventory carrying cost | $0.15 | $0.50 | 25% per year × weeks held ÷ 52 × landed value |
| Quality and inspection | $0.05 | $0.15 | Incoming inspection; offshore adds third-party pre-shipment inspection |
| Expedite and risk allowance | $0.03 | $0.30 | Offshore: about $3,000 a year of air freight to cover a late shipment |
| Total landed cost | $7.82 | $7.40 | Offshore is $0.42 (5%) lower |
Why did a 34% price gap shrink to 5%?
- Duty is the largest single addition at $1.20 per part, and it applies to tooling as well as the part, because buyer-funded tooling is generally a dutiable assist.
- Inventory carrying cost more than triples, because 16 weeks of parts are paid for and sitting in the pipeline instead of 4.
- Freight more than triples per part, even by ocean.
- Risk costs real money: a single late container means air freight or a line stop.
Unit price is 82% of domestic landed cost but only 57% of offshore landed cost. The other 43% is where offshore comparisons usually get optimistic.
How sensitive is the result to tariffs?
Duty is the line most likely to change during a program. Holding everything else constant, here is how the offshore landed cost moves with the assumed combined duty rate.
| Assumed duty rate | Duty per part | Offshore landed cost | Compared with domestic |
|---|---|---|---|
| 0% | $0.00 | $6.10 | $1.72 lower (22%) |
| 10% | $0.48 | $6.62 | $1.20 lower (15%) |
| 25% | $1.20 | $7.40 | $0.42 lower (5%) |
| About 33% | $1.58 | $7.81 | About even |
| 50% | $2.40 | $8.69 | $0.87 higher (11%) |
What does one quality escape do to the math?
Suppose one shipment of 2,500 parts arrives with porosity in a sealing bore. Sorting, rework, and air freight for 1,000 replacements cost $8,000. Spread over the year's 10,000 parts, that is $0.80 per part, and offshore landed cost rises to $8.20, $0.38 above domestic at the 25% duty assumption.
Domestic suppliers have escapes too. The difference is containment speed: replacements arrive by truck in days, not by ocean in weeks, so fewer parts are at risk and air freight is rarely needed.
What shifts the answer toward offshore or domestic?
| Favors offshore | Favors domestic |
|---|---|
| Higher volume, full container loads | Lower volume, partial shipments |
| High labor content, such as manual trimming or assembly | Automated process with little labor |
| Low or zero duty for the HTS code and origin | High or unstable duty exposure |
| Stable design, long program life | Frequent engineering changes, new launch |
| Light, high-value parts | Heavy, bulky, low-value parts |
| Proven supplier with a clean quality history | Critical-to-line parts where a stockout stops production |
How do you build your own landed cost model?
- Get quotes on the same basis: same drawing revision, material, finish, quantities, and packaging.
- Convert every quote to the same Incoterm.
- Confirm the HTS classification with a licensed customs broker, then look up the current base rate and any additional duties for that code and origin.
- Add buyer-funded tooling to customs value as an assist.
- Price freight for your actual lane, mode, and shipment size.
- Apply your company's carrying cost rate to landed value and real weeks of inventory.
- Add quality and risk allowances based on history with the process and supplier.
- Run at least three duty scenarios, and rerun the model whenever tariffs or volumes change.
How can SSG help compare domestic and offshore quotes?
SSG represents die casters and other principals in the US and overseas, so one RFQ can return both quotes on the same basis. Start in the builder at /build for an instant budgetary estimate and DFM feedback, then an SSG rep routes the RFQ to matched principals for firm quotes you can drop into a model like this one. Independent reps can join the network at /network and submit jobs for their customers.